Monday, June 4, 2012

KNOBOLOGY: What's the Frequency Kenneth?

Perhaps you are too young to remember that REM song from the mid 1990s, but it does ask an important question:  What's the frequency (of any given probe)?  If each probe has a range of frequencies, how can you adjust or change the frequency within that range?  On large and fancy ultrasound machines, the ability to change the frequency of a given probe is done by the press of a button.  However, as our machine is simplified for the ease of use in the ED, it does not allow us to dial down the frequency at will.  But do not fear, we can still adjust the frequency to optimize our imaging goal of deeper penetration vs. more detail:
Note that it states GEN on the screen, which denotes the General setting: a mid range frequency to give us the best of both worlds, detail and penetration.  However, what about those times when you have a patient who is morbidly obese and you are unable to make out much detail?  This is the time to lower the frequency to allow the sound beam to penetrate deeper into the body, past the subcutaneous fatty tissue and allow you to see intra abdominal organs. 
By changing to PEN mode we are not selecting an exact frequency, but we are lowering the frequency enough to improve visualization but at a cost: the image looses some of the detail making it more grainy.
Now what if you just want more detail on a struture that is closer to the probe?  Then changing to the RES mode will increase the frequency and make the image clearer, but at the cost that you will not be able to go as deep.  You can also improve your resolution by increasing the frequency by changing the probe you use.  By going from a low freqncy probe to a higher frequency probe, you will get more detail in your image.

Just remember: penatration and resolution are opposites.  You cannot have it both ways, if you increase pentration, you will lose clarity.  To improve image resolution, you will be limted by depth.
I guess we can't have it all now can we?

Monday, May 28, 2012

ABCs of Lung Ultrasound

So today we're gonna focus on the lungs.  I think we are all familiar with how to scan for pneumothorax and for pleural effusions/hemothorax as part of the Extended FAST exam, but what about pathology within the lungs themselves?  I know what you are thinking, "Duran, I thought you said that we can't see the lungs on ultrasound.  They're full of air."  You are correct, however, if the lungs are either surrounded by fluid or if they are fluid filled then you can see them on US.  So that brings us to advanced lung ultrasound or the A's and B's of Lung US.

Let's start with A or A-lines.  A lines are a normal finding on lung US and you have probably seen them before and not really paid much attention to them.  They are a reverberation artifact.


Notice that each line is equally spaced?  Notice also that they do not continue all the way down the screen.  This occurs because the sound wave is bounced between two reflectors.  Each time it hits the reflector it bounces a portion of the sound beam back to the machine.  Eventually the entire sound beam is consumed.

So the appearance of A-lines on lung US is completely normal and should be expected.

On the other hand, B-lines are not normal and indicate "intraparenchymal lung fluid."  Huh?  The lung is normally full of air, but in pathologic states, it become like a sponge and the alveoli become full of fluid.  US can't tell if the fluid is pus as in a pneumonia, blood as in a pulmonary contusion or extracellular fluid as in pulmonary edema.  It can just tell you that the lung parynchema is full of fluid.  It is up to you as the clinician to determine the cause.  So what does intraparenchymal fluid look like?

At it's simplest it appears as B lines.  B lines are comet tail artifacts that begin at the pleura and continue to the end of the screen.

 
Seeing 3 or more of these B lines in a single rib interspace is pathalogic, but they often present as a curtain or spotlight moving accross the screen as the patient breaths.
video
When the lung becomes completely full of fluid, such as in severe pulmonary edema or severe pneumonia,  the lug will start to resemble liver tissue.  Notice in the picture below how much the lung and the liver look alike.  The presence of a pleural effusion make it easier to see the lung as it surrounds the lung, increasing visualization.


So how do we scan the lungs efficiently to look for fluid within the lungs themselves?

The Lung Scan Protocol
The protocol for scanning the chest for intraparenchymal fluid is a little more extensive and time consuming than the E-FAST scan we do for pneumonthorax.  This protocol requires that we divide each side of the chest into 5 segments:  2 anterior, 2 lateral and 1 posterior.  The anterior and lateral chest are each divided into two segments:  upper and lower.


Each individual segment must be scanned in order to accurately rule out fluid.  Therefore, there should be a picture from each segment submitted for this protocol- meaning 10 pics total as both sides need to be scanned.

There have been several articles in the literature recently dicussing the use of ultrasound prior to even plain CXR for the diagnosis of pneumonia.  Although these studies show good results in that US was able to accurately determine pna, I am not sure that it will replace the good old CXR.  Interestingly enough pneumonia can appear as B lines or if it is large enough, air bronchograms may be visualized on US!  Amazing, right?  Here are a couple of pics taken from these articles illustrating air bronchograms on US.  Check out these articles if you get a chance or scan your next patient with pneumonia and see if you can see this.
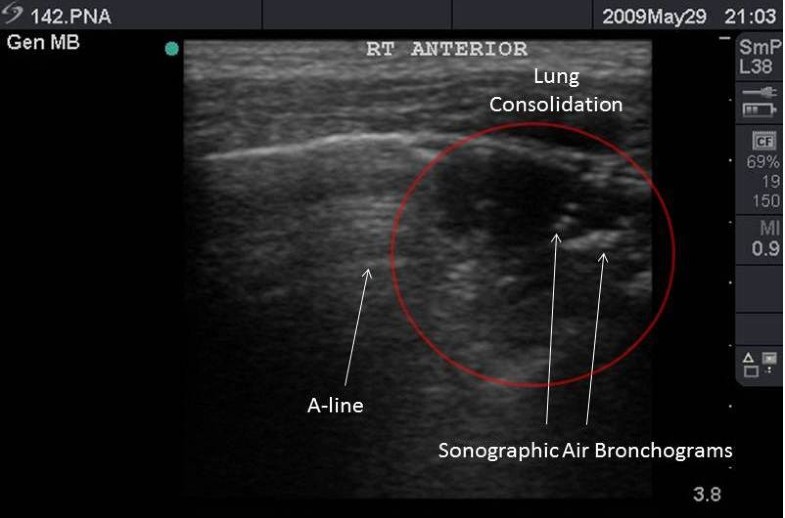
Figure 8 

Prospective application of clinician-performed lung ultrasonography during the 2009 H1N1 influenza A pandemic: distinguishing viral from bacterial pneumonia.Tsung JW1, Kessler DO, Shah VP. 2012 Jul 10;4(1):16. doi: 10.1186/2036-7902-4-16.


Is lung ultrasound superior to CT? The example of a CT occult necrotizing pneumonia.  Lichtenstein D1, Peyrouset O2. 2006 Feb;32(2):334-335. doi: 10.1007/s00134-005-0004-6. Epub 2006 Jan 27.16468074 doi:10.1007/s00134-005-0004-6


The dynamic air bronchogram. A lung ultrasound sign of alveolar consolidation ruling out atelectasis.  Lichtenstein D1, Mezière G2, Seitz J3. 2009 Jun;135(6):1421-1425. doi: 10.1378/chest.08-2281. Epub 2009 Feb 18.


Monday, May 21, 2012

PHYSICS IS FUN: Enhancement vs. Shadowing


Good vs Evil.  Enhancement vs. Shadow.  How does that play into Ultrasound you may ask?  Last month we talked about how sound waves are affected by the media they travel through...think back to the tennis ball analogy.   Now let's now talk about how that affects the picture we see on the screen.

Dense objects block sound waves from penetrating further, just like a brick wall blocks the tennis ball from entering the next room.
Since the sound waves are blocked from penetrating further into the tissue, there is a void of sound (no tennis balls in the adjacent room).  This void prevents us from visualizing structures below the dense object.  This is the reason why we do not routinely use ultrasound to guide vascular access in the subclavian vein:  the vein is sub-clavicle and is thus shadowed from view.  This is called Acoustic Shadowing.


So what about the opposite: the tennis ball that goes through a doorway?


Fluid is our friend and allows sound waves to completely penetrate through liquids.  Therefore, few sound waves are returned to the machine before hitting the fluid interface.  Once in the fluid, all sound waves continue on, as if through a wormhole, to come out on the other side of the fluid interface.  Now you have a much stronger beam of sound distal to the fluid collection when compared to the surrounding tissue.  Since sound waves get progressively weaker as they travel father away from the sound source (probe), the sound waves that had to go through the soft tissue on either side of the fluid interface will be weaker. These weaker sound waves have less amplitude and therefore, do not look as bright.


The sound waves that went through our fluid wormhole will appear brighter or have a higher amplitude distal to the fluid when compared to the surrounding tissue.


This phenomenon is called Acoustic Enhancement.

This can be very useful to us.  It will allow us to visual distal structures better, such as the uterus.


It can also create problems though as well, such as during the FAST exam.  Imagine that there is a small fluid collection in the pouch of douglas.  The acoustic enhancement of the bladder can make visualization of this fluid appear overgained and not black, causing you to miss a positive FAST exam!
So when looking at structures distal to a fluid collection such as the bladder, be sure to use the distal TGC button to adjust the gain in that distal area, allowing fluid to become more visible.

Note that when the TGC is turned down, the distal structures start to differentiate.


Hopefully you can also tell the difference between acoustic shadowing versus acoustic enhancement now.

Monday, May 14, 2012

Soft Tissue Infections

So you have a patient that has a painful and red area on his thigh, how can you use ultrasound to differentiate the type of infection: cellulitis, abscess, nec fas?

The normal structure of the skin. Notice how well organized everything is.


 Now, if you look at edema within the soft tissue you will note that fluid is collecting within the soft tissue planes, spreading them apart.  This first becomes appart as a phenomennon called columning.  The fluid appears to create black columns that appear to seperate the tissues and destroys the architecture.

As the infection progresses, edema seperates the tissue planes further, illustrating individual fat lobules.  Now the soft tissue takes on the appearance of a cobblestone street.  This appearance is called cobblestoning and further demonstrates cellulitis.


Eventually the infection coalesces and collects into a pocket of fluid or pus, creating an abscess.  An abscess will appear as a irregularly shaped fluid collection which appears to have tenticles that reach into the surrounding soft tissue.


Can you see the difference?

So how do we scan our patient?  First start with a high frequency probe to give us a lot of detail and place it on the small parts setting


Then start with an area that is not affected adjacent to your area of interest.  Scanning here briefly will allow you to see the normal structure of the tissue so that as you slide over to the affected area, the edema and disruption of the tissue plane becomes more apparent.  Slide over the affected area in both a long and transeverse plane to clearly image the area in all dimentions.  If a fluid collection is seen, compress it gently.  Many times when an abscess is present you can see the purulent matrial within swirl around.  This finding confirms that this is an abscess.

So now there should be no question as to whether to open up an area or to give antibiotics and warm compresses and discharge for a recheck in 48 hours!

Monday, May 7, 2012

KNOBOLOGY: What Is TGC?

So perhaps you have noticed the two knobs/buttons on the left side of the ultrasound keyboard above the gain button.  Well, what are they? 


These are the Time Gain Compensation knobs.  I know what you are thinking, the what?

Well, lets begin with a review of what the Gain button is first.  The Gain adjusts the amplitude of all the  sound waves returning to the machine from the soft tissue.  Think of the Gain as the overall volume control on your stereo system.
It makes the overall sound louder or quieter, but can't adjust the specifics of the music.  That's where the TGC comes in.

TGC is like the treble and bass adjustments on your stereo.  They adjust the sound in specific ways.

The TGC often appears as slides on larger US machines


Each of these slides controls the gain to a specific line on the screen.


So why would we need to adjust the gain in different areas of the screen?  The reason for this has to do with attentuation, the progressive weakening of sound over distance.  As our sound beam travels farther from the probe it becomes weaker and the amplitude of the returning sound waves becomes lower. 


To counteract this low amplitude sound, we need to increase the gain or amplitude of those soundwaves so that we can make an image visible.  The opposite is true to ojects that are close to the probe.  Since they are so close, the returning sound wave has a much higher amplitude, so the gain must be turned down a bit to create a uniform image.  On a larger US machine, the slides would then appear as a curve to adjust the gain at each level.


Our machine is not so fancy, after all, we are trying to make rapid decisions based on our scans at the bedside.  Our machine makes it simple by only giving us two choices.  We can adjust the gain in the near or the far field only.


Although this decreases the fine control of our image, it does aid us in visualization, especially of distal structures such as the uterus or the rectovesicular pouch or pouch of douglas on the FAST exam. 
Now lets adjust the distal gain and suddenly the uterus is visible!  This can make visualization of the uterus easier, but can also help to determine of there is scant free fluid in the pelvis on trauma patients.

So the next time you're using the machine, take a closer look at the TGC buttons, they can definitely make your images richer!